


Rapid Own Source Revenue Analysis for Sustainable Cities
ROSRA helps local governments estimate OSR improvement potential, diagnose where revenue is being lost, prioritize reform areas and access practical reform guidance.
How the ROSRA diagnostic works
ROSRA starts with a quick estimate of the overall room for own-source revenue improvement. It then moves into a stream-level diagnosis, breaking down where revenue is being lost across coverage, compliance, and liability or valuation gaps. The tool then helps users prioritize which issues to address first and points them to practical reform guidance. The final output is a ROSRA Diagnostic Report.
Quick potential estimate
Fast view of overall OSR potential
Stream-specific gap analysis
Identify where revenue is being lost within each stream
- Coverage
- Compliance
- Liability / Valuation
- Coverage
- Compliance
- Liability / Valuation
- Coverage
- Compliance
- Liability / Valuation
Prioritization
Rank streams and gaps by selected criteria
- 1
- 2
- 3
Reform guidance
Match the diagnosis to practical actions
Report output
What ROSRA helps users do
Three things the ROSRA diagnostic gives every local government using it.

Estimate OSR opportunity
Understand the overall room for improvement.

Diagnose revenue gaps
Identify whether revenue is being lost through coverage, compliance, liability or valuation problems.

Prioritize reform action
Focus attention on the streams and gaps that matter most.
Own Source Revenue Types
OSRs are taxes, fees, licenses, and other revenues directly controlled by local governments.
Why optimize Own Source Revenue?
Increase resources for local priorities.
Reduce excessive dependence on inter-governmental transfers.
Strengthen accountability and the social contract.
Improve financial foundations for investment.
Supported by UN-Habitat municipal finance experience
ROSRA builds on UN-Habitat's work with local governments on own-source revenue, municipal finance and reform prioritization.
A closer look at the diagnostic
A closer look at the four core diagnostic views. Each screenshot below is from the Kampala (Uganda) sample report.
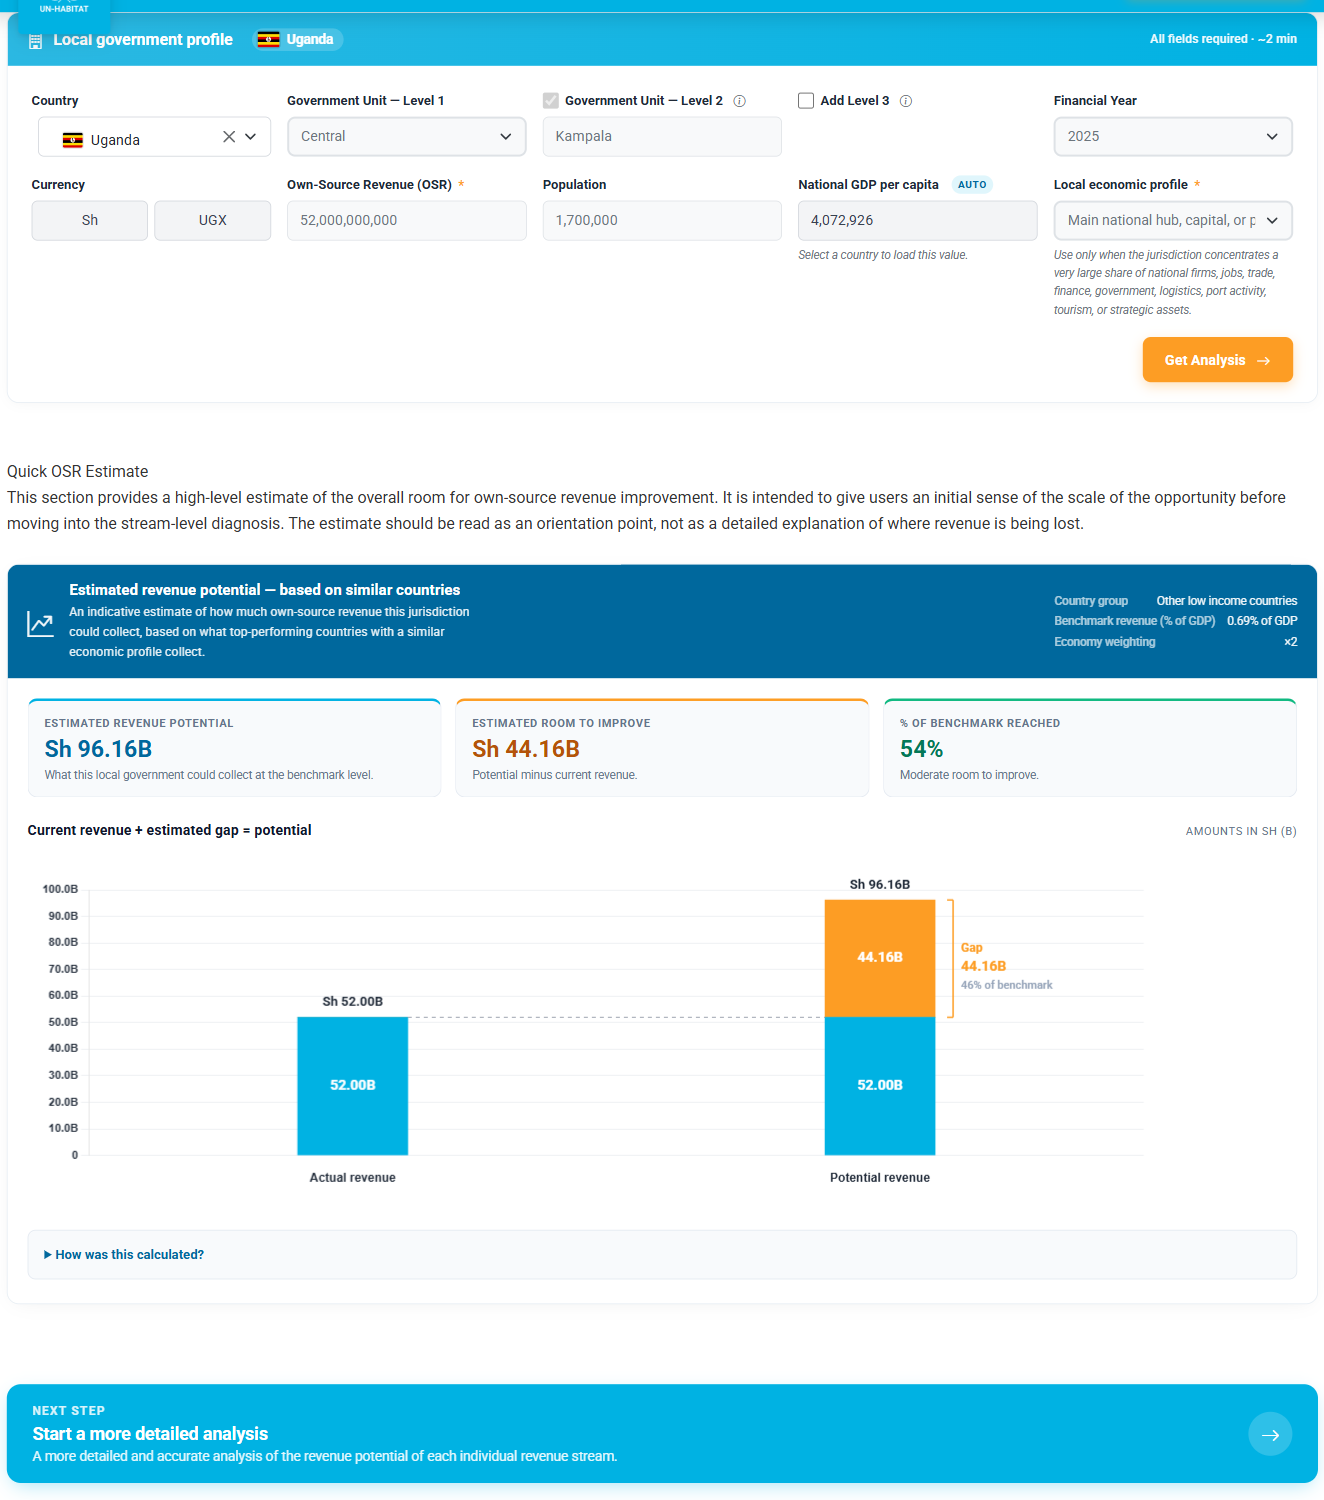
Quick Analysis — Local Government Profile
Before diving into stream-by-stream detail, ROSRA produces a top-down snapshot. The city fills in a one-screen Local Government Profile — country, financial year, currency, current OSR, regional GDP and population — and the WoFi estimator benchmarks the city against peer subnational governments globally. In seconds you see today's revenue, the estimated revenue potential, the gap between them, and a frontier index that places the city on the global revenue-effort scale. It's the orientation step: it tells the reform team how much headroom they're working with before they pick which streams to dig into.
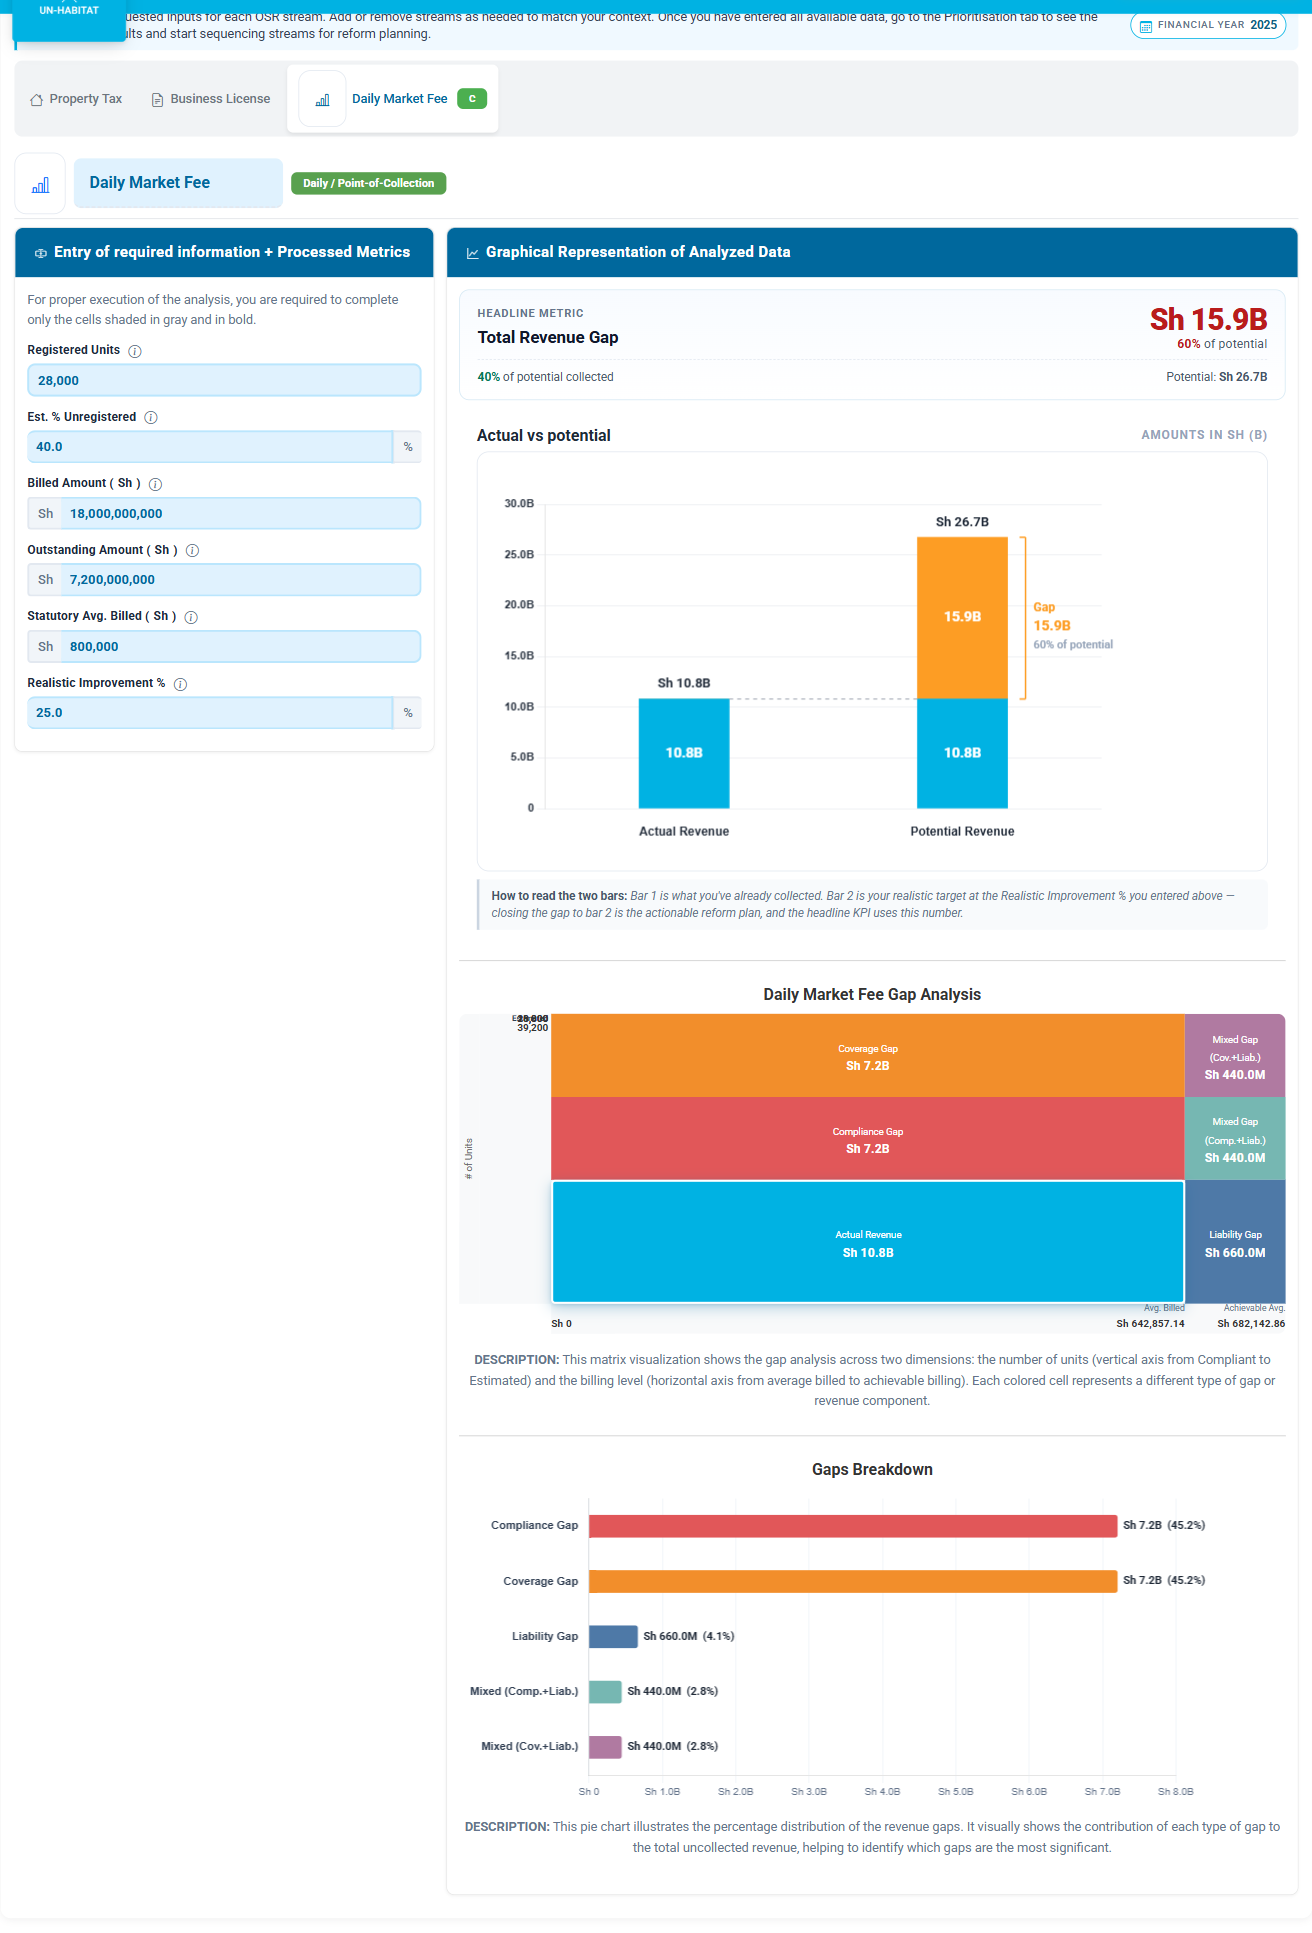
Stream Gap Analysis
For each revenue stream, the city enters only the inputs in the gray-shaded cells — registered units, billed amount, outstanding amount, statutory benchmark — and ROSRA decomposes the gap between current collection and full potential into specific drivers: Compliance, Coverage, Valuation or Liability, and the mixed gaps that combine them. The matrix dashboard on the right makes it instantly visible where each shilling is slipping through. Streams that don't apply to your context can be excluded.
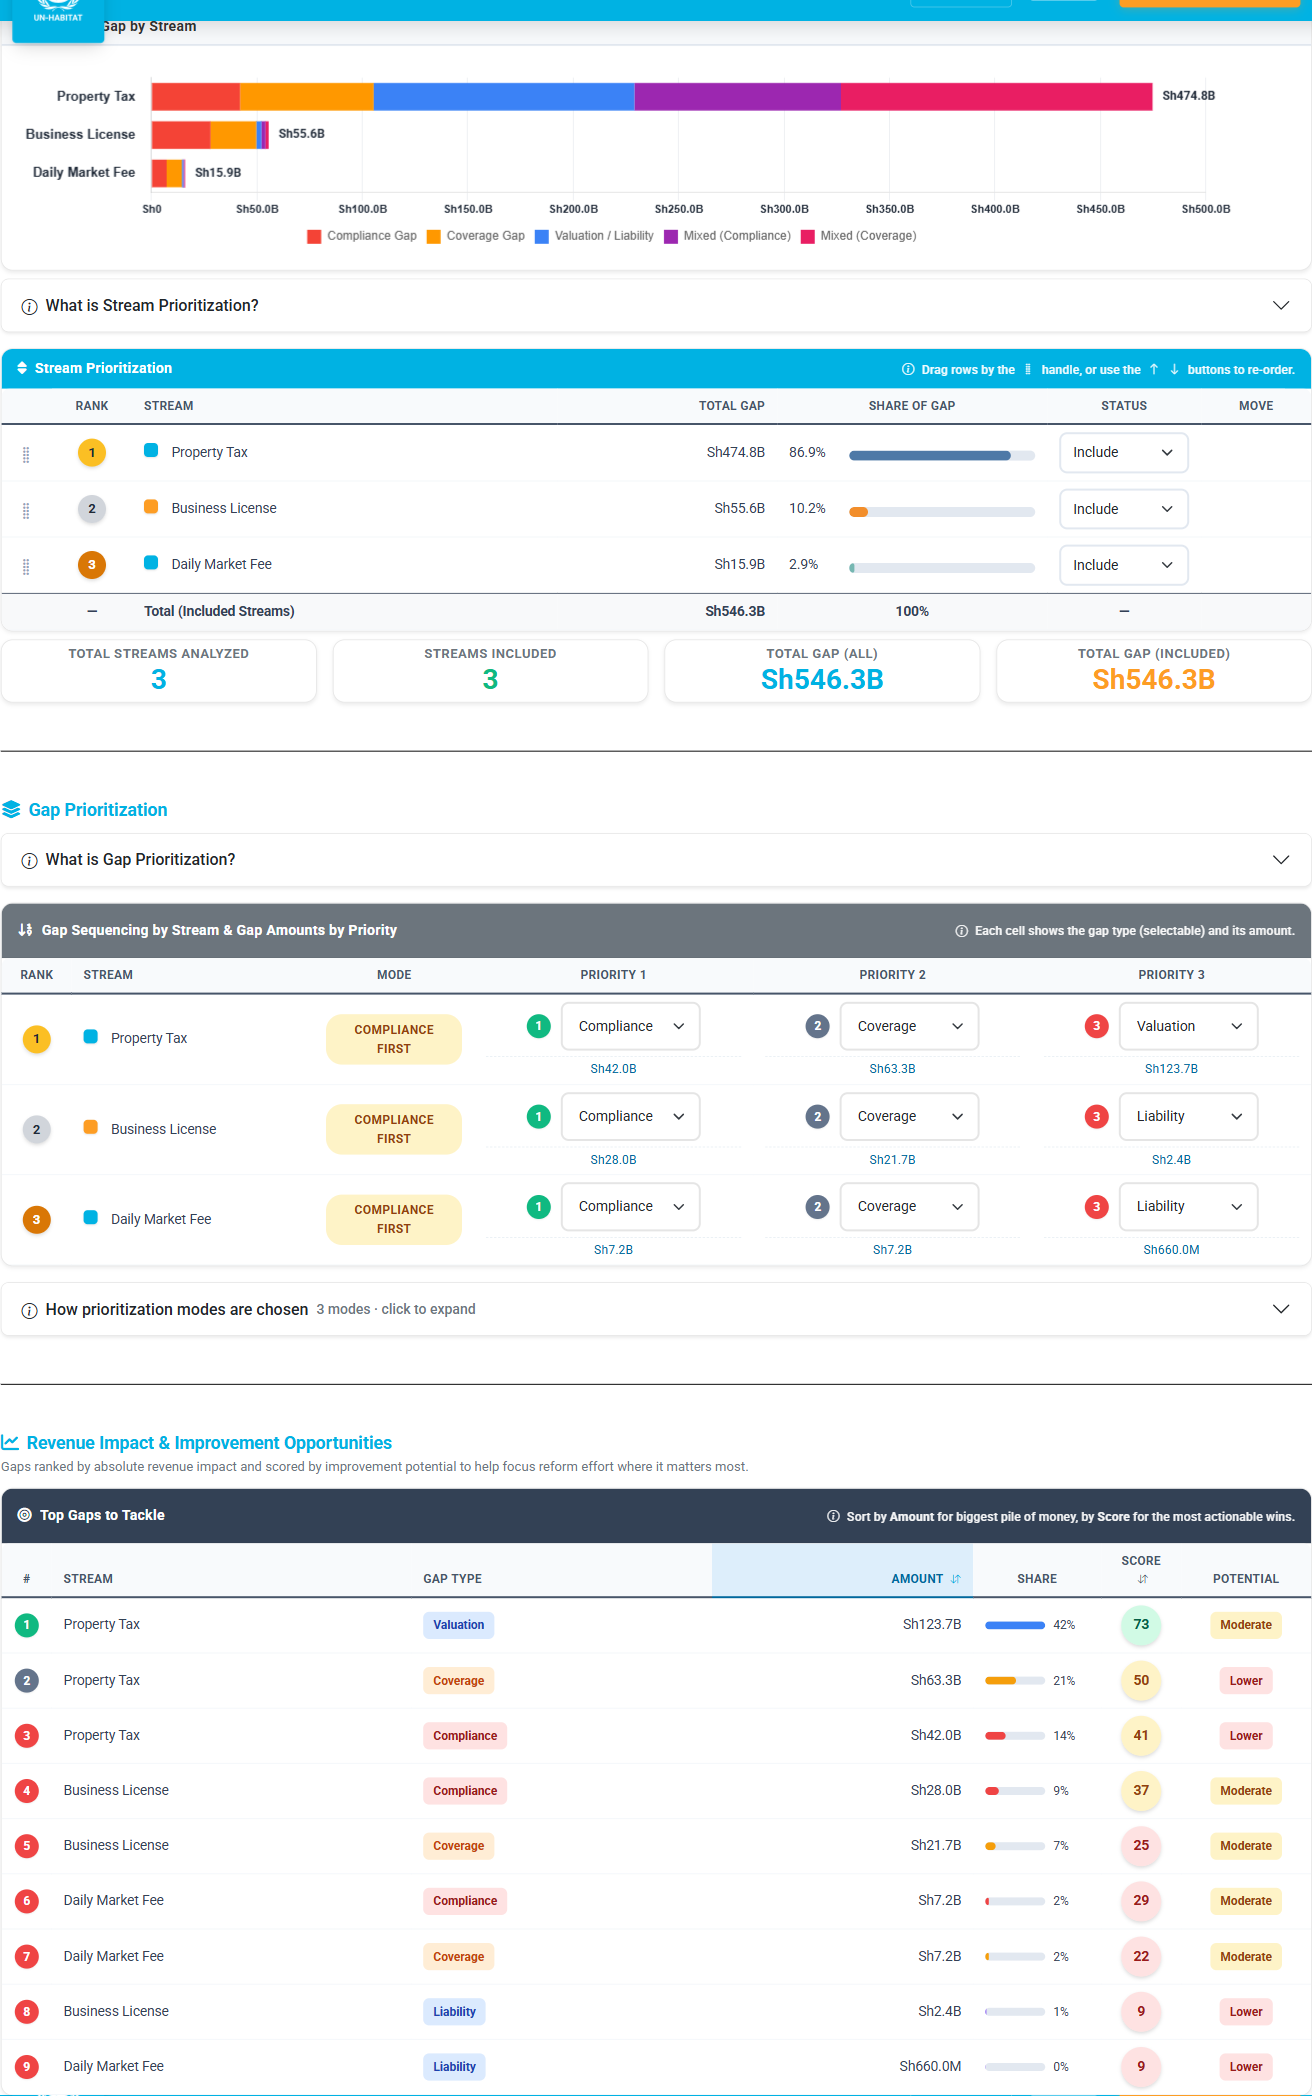
Prioritization
Streams are ranked by their Total Functional Gap and broken down per gap-type — Compliance, Coverage, Valuation/Liability, and the mixed gaps — in a single stacked bar so the city can see at a glance which reforms move the most revenue. Decision-makers can re-order, exclude, or remove specific gap-types that aren't politically feasible. Excluded streams (like Solid Waste Fee here) are dropped from rank, share, the bar chart, and the downstream Reform Guidance — the plan respects local realities, not just the math.
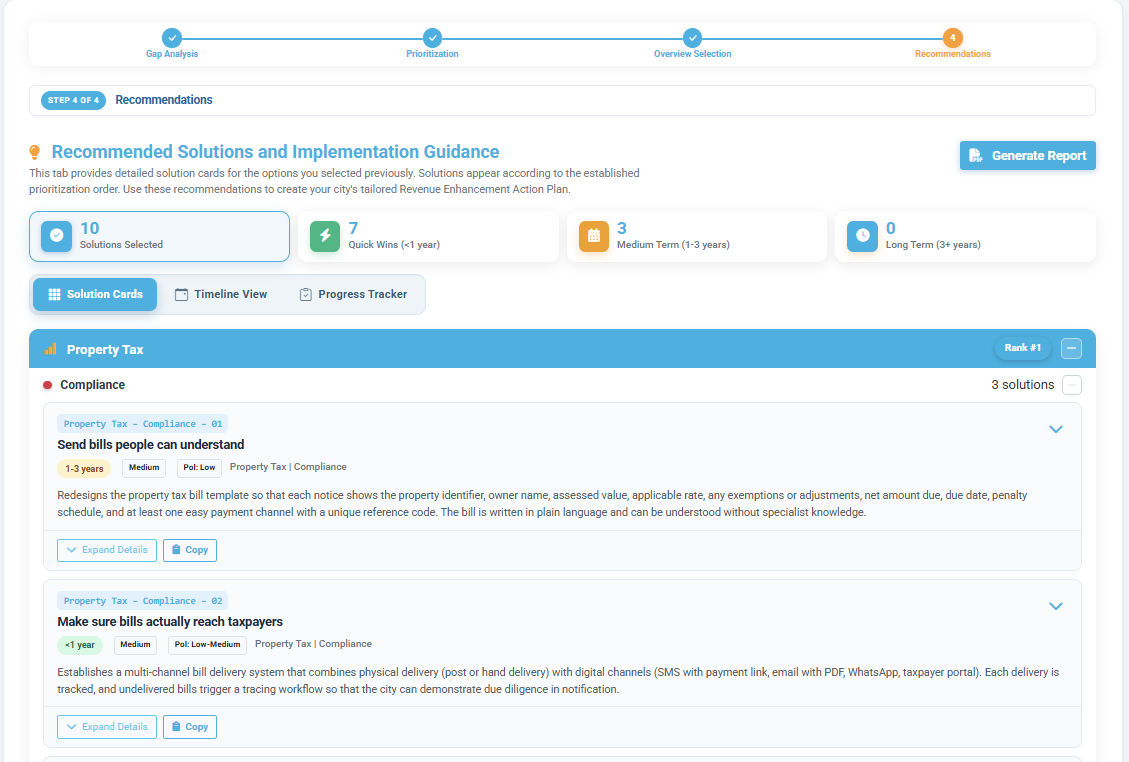
Recommendations
The selected reform options are organized by stream and priority, with each card timeline-tagged as a Quick Win (<1 year), Medium Term (1–3 years), or Long Term (3+ years). Switch between Solution Cards, Timeline View, and Progress Tracker views — then export the results as a ROSRA Diagnostic Report (PDF or HTML).